Monday, August 29, 2016

August 2016 - Quarterly Review

It's time to check out how the May2014, May2015 and May2016 portfolios are doing.

May 2014


The overall return of the M2014 portfolio is just under 8%, averaging about 4% per year.  Losing stocks are WFT, LNR, STN and EQB.  GIB.A two year return is 73%, nice. GC and GIL round out the other winners with 42% and 33% gains respectively.


This is the performance graph since inception.  2016 is on track to be a tepid year for this portfolio.


The M2014 portfolio performance graph above as compared to the Toronto Stock Exchange for the same period. According to Google Finance, the portfolio is doing 10% better than the TSX, which has been essentially flat for the past two years.

May 2015


DH continues to struggle with it's stock now down 28%, but thankfully ATD.B is up 40% in our M2015 portfolio.  EMA and WPK are giving decent double digit returns for the year.  T, NA and SJ are more or less even.  The return for this portfolio after 15 months is 5%, which is just OK.


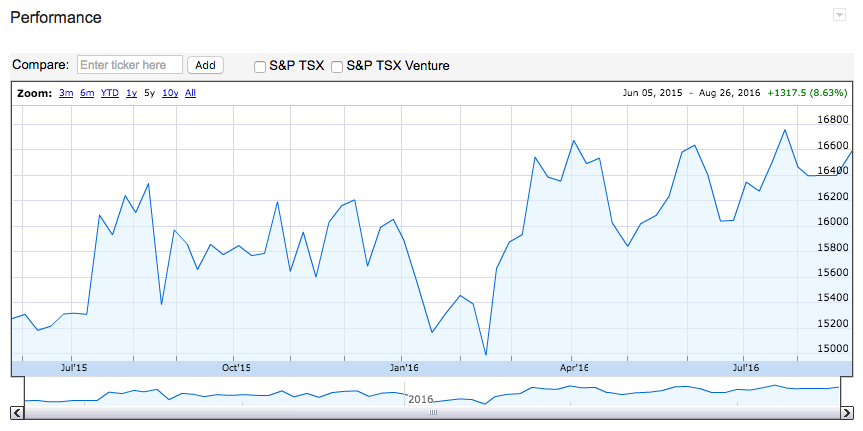
M2015 portfolio performance graph will hopefully continue it's upward movement.


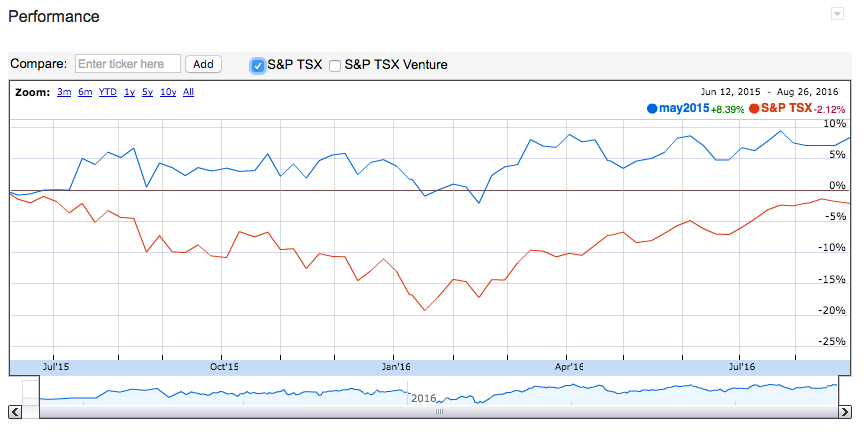
It's interesting to point out that the M2015 to TSX performance differential of about 10% is about the same as the M2014 vs. TSX.  Different timeframes (2 years vs 1 year) , but same relative performance.   You can see that the TSX was down close to 20% this past winter, but has now recouped it's losses.
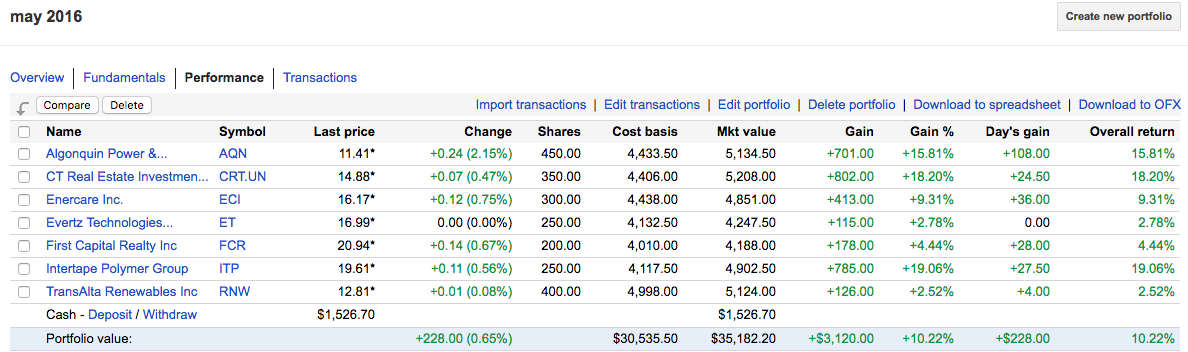
May 2016


The newest portfolio is now showing a 7% return after 3 months.  The dividends returned is about 1% this quarter, so we are on track for a 4% overall dividend yield.  So far, no losers in this basket, but the last minute pick of NWC is just treading water right now.  The rest of the stocks are doing well, so I'm hoping it will continue it's performance into next year.

Overall the performance graph of the M2016 portfolio looks great, but it looks like it's due for a downturn in the next few months.


Since May of this year, the TSX has increased by about 5% and the M2016 portfolio is doing just a bit better at 7%.
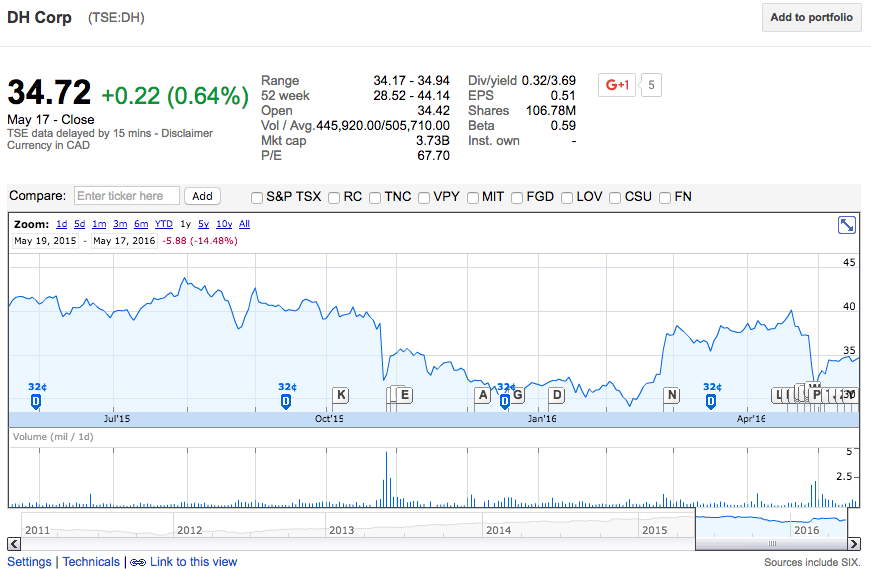
NWC vs. ET


If you read my previous post, you'll know I originally had Evertz Technology ET in the M2016 portfolio and then I replaced it with NWC.  Comparing the performance of the both stocks reveal that they both kinda suck, although ET did move up 8% in the month of June only to give it all back later.


So I went back and reviewed the 5 year stats for ET and it's showing 45% return. Did I look at the wrong graph back in May 2016 because I thought it had a much weaker 5 year return?


Here's the 5 year return graph for NWC, also showing a return of 45% over 5 years.   Heh, these two stocks are almost identical in performance and fundamentals.


And here's a poo emoji, just because.


Well, that's it for August 2016.  See you in November 2016 for another update.  Thanks for looking.

Sunday, May 22, 2016

May 2016 - New Portfolio

Welcome.  


It's time to pick some new stocks for our new May 2016 Portfolio.  If you are interested in the most current returns and performance of previous years portfolio selections, see the previous two blog posts.

Last minute chgs: see end of blog post for details.

Stock Criteria


This year I wanted to focus on smaller cap stocks that have a dividend yield of around 4%.  Here are the stocks I have selected that satisfy the criteria.


Current stock prices are between 10 and 20 dollars per share approx.

Market capitalization is between 1 and 4 billion dollars.


Stock Selections

In keeping with our past theme of 7 stocks and as much diversification as possible, here are the picks.
The initial portfolio value is about $35,000, with each stock purchase worth about $5000.  Overall portfolio dividend yield target is above 4%.


AQN div yield: 4.77%, 5 yr return:  96%


CRT.UN div yield: 4.57%, 5 yr return: 47%


ECI div yield: 5.71%, 5 yr return: 114%


ET div yield: 4.24%, 5 yr return: 3%


FCR div yield: 4.11%, 5 yr return: 25%


ITP div yield: 3.42%, 5 yr return: 1165%, yes you read that right.


RNW div yield: 6.87, 5 yr return: 28%


Stock Historical Performance


In April of this year, I started doing my research and modelled this portfolio as if I had bought the stocks in the preceding year.  If I had picked these stocks last year, the portfolio would have a return of over 10%, which is much better than the current stock returns of the May 2015 portfolio.  The dividends alone on this portfolio amounted to $1500 in one year.


Pictured above is the one year performance graph of the May 2016 portfolio, May 2015 thru May 2016.  


May 2016 Portfolio


Ok, so I've reset the portfolio dates to commence on Fri, May 20, 2016, with the stock prices reflecting their end of day values.  Commissions are factored in, assuming $10 per trade.  Initial portfolio value is approx $35K.  Let's see where this one goes, hopefully I can do better with the stock picks than my past two portfolios.  Will revisit this and the other portfolios in 3 months time.


Last minute Update


So I was just checking the 5 year returns of the stocks and noticed that Evertz Technologies hasn't done that well at just 3% overall return.  Hmm.


I think I will swap it out for NWC instead.  It's got a 5 yr return of 45% and it's div yield matches our critera of 4.26%.

So the new portfolio looks like this:


http://www3.nhk.or.jp/nhkworld/en/vod/facetoface/20160522.html

Wednesday, May 18, 2016

May 2015 Portfolio Update as of May 17, 2016 2.5%

Ok, so we just looked at the poor performance of the May 2014 portfolio with it's one year loss of 16%.   And for the first time, it underperformed the TSX.   Now, let's see if the May 2015 portfolio fared any better.


And we see that the one year return of the May 2015 portfolio is about 2.5%.  That's about 2% more than what the banks will give you on a GIC currently.   This portfolio has not been immune to the stock market woes of late.

We are just a few weeks shy of the one year anniversary for the May 2015 portfolio.  A look at it's performance as compared to the TSX, shows us that the portfolio is doing better by about 15% over the past year.  Good news, that.

We again have a mix of crappy performing stocks and better ones.  So my stock picking skills still need improvement.  Let's look at the stocks.


DH Corp (DH) used to be one of the best performing stocks in this portfolio but it has recently been targeted by short sellers.  It is now down 15%, since portfolio inception.   Motley Fool thinks it's a good buy for patient investors (like us!).

http://www.fool.ca/2015/10/30/down-over-10-this-month-dh-corp-could-be-a-screaming-buy/


National Bank (NA) hasn't done well at all in this portfolio and is now down 14%.  I thought that it would have had a better return than the big banks, but I was wrong.   Really wrong.  The peer comparison graph and one year returns says it all.  However,  Motley Fool says now is a good time to buy NA.

http://www.fool.ca/2016/05/09/national-bank-of-canada-a-contrarian-bet-on-canadas-economic-recovery/

Telus is the other laggard in our May 2015 portfolio.  If it wasn't for it's stellar dividend yield, this stock return would be much lower.  It's down 2.5% on the year.  Motley Fool says Telus or Bell (BCE) are good to have in one's portfolio.

http://www.fool.ca/2016/05/11/should-you-buy-bce-inc-or-telus-corporation-today/


Stella Jones (SJ) has done alright in 2016.  It's up 5% over the past year.  What's confusing to me is why this stock is doing so much better than West Fraser Timber (WFT) during the same timeframe.  Both stocks are in the Forestry sector, so the poor US lumber prices that impacted WFT should also have affected SJ?  I guess I have to do some more research on these two companies and find out what's different about them.  Motley Fool says SJ is more influenced by the oil industry than being a wood producer, and thinks it's time has come and gone.

http://www.fool.ca/2016/01/15/stella-jones-inc-shares-have-returned-1000-over-10-years-can-the-run-continue/


We have way more winners than losers in the May 2015 portfolio vs. May 2014 portfolio.  Emera (EMA ) is one of the winners with a 12% return during the past year.  Dividend yield is good too.

Motley Fool says that either EMA or FTS should be in your portfolio.

http://www.fool.ca/2016/05/16/is-fortis-inc-or-emera-inc-the-better-buy-today/

ATD.B has given us a 15% return in the past year, but in the last couple of months it has lost steam.  Not sure if it's good performance will continue into the coming year.  Motley Fool says it's a good buy between $45-$52 dollars per share.

http://www.fool.ca/2016/04/20/can-alimentation-couche-tard-inc-rise-another-800/


The best one year return of this portfolio belongs to Winpak (WPK) at 18%.  Chart shows that it continues to look strong.  Here's what Motley Fool says:

http://www.fool.ca/2016/03/08/winpak-ltd-the-steady-consistent-performer/


Will check back in, around the end of August.

May 2014 Portfolio Update as of May 17, 2016, 3.6%

It's been two years since I created the May 2014 portfolio and this year has been a challenging one. Here's how it looks before market open this morning.


The current performance shows an overall return of just over 3.5%.  Given that this portfolio is two years old, that gives us an average return of 1.7% per year.  Meh.


In the past month alone, the portfolio has lost 5%.  The TSX did much better this month at over 4%, so our relative performance by comparison is down 9%.


The above graph shows us how bad it is.  The portfolio lost 16% over the past year.  Compared to the TSX, the May 2014 underperformed for the first time by 8%.  So bad.


The two major contributors to the poor portfolio performance are West Fraser Timber (WFT) and Linamar (LNR).  Both stocks are down 37% since last year.  Last July, Motley Fool warned against buying WFT due to a sharp decline in U.S. lumber prices.

http://www.fool.ca/2015/07/23/should-you-buy-or-avoid-west-fraser-timber-co-ltd-today/

However, Motley Fool sees an upside to Linamar's value with their latest analysis last month.

http://www.fool.ca/2016/04/18/should-you-buy-magna-international-inc-or-linamar-corporation/

Guess we won't see any upside on WFT for awhile, so let's hope there's a rebound for LNR at least.

The remaining stocks in the portfolio haven't fared much better, sorry to say.


Our double digit returns from Great Canadian Gaming (GC) have also been hampered this year, down 23% since last May.  Motley Fool think the valuations on this company are reasonable.

http://www.fool.ca/2016/04/27/are-these-3-gaming-stocks-a-good-gamble-for-your-portfolio/


Equitable Group (EQB) continues to underperform the TSX as well, down 12% since last year.
Motley Fool doesn't think there's anything fundamentally wrong with EQB.

http://www.fool.ca/2016/05/17/3-top-financial-stocks-for-fundamental-investors/


Stantec's (STN) return is negative 9% for one year.  Pretty consistent performance since the inception I think.  Motley Fool thinks there's potential upside to STN for 2016.

http://www.fool.ca/2015/12/18/3-top-engineering-stocks-for-2016-and-beyond/

Gildan (GIL) was not spared either, despite doing well initially.  Down 4% in the past year.  Motley Fool thinks GIL is a solid long term investment.

http://www.fool.ca/2016/05/06/gildan-activewear-inc-s-adjusted-q1-eps-jumps-16-7-is-now-the-time-to-buy/


And finally a silver lining amidst all the dark clouds.  CGI Group (GIB.A) is the only stock in the portfolio that had a positive performance in the last year with almost a 10% return.  It continues to be the best performing stock overall in the May 2014 portfolio.  Motley Fool says it's a good long term investment.

http://www.fool.ca/2016/04/27/cgi-group-inc-s-q2-eps-rises-10-3-should-you-buy/

We will check the portfolio again in August 2016.

Thursday, April 7, 2016

March 2016 Portfolio Updates

And we're back.  Sorry, I got lazy and figured my posts were TLDR (too long, didn't read).  Thanks to Victor for getting me to update this blog again.


Quick August 2015 recap


Here's a performance recap of where the May 2015 and May 2014 portfolios stood last year August 2015.  May2015 portfolio was up 1.6% after 3 months.   May2014 portfolio was at 9.87%.

At that time, the best and worst performers respectively for the M2015 portfolio were ATD.B (up 15%) and NA (down 12%).  GIL was up 42% and EQB was down about 10% in the M2014 portfolio.


The TSX


From August 2015 through to October 2015, the TSX was down, then up.  Then in November, things really started to tank.  The lowest point was in mid-January 2016 where the TSX lost nearly 14% from August 2015 levels.   Oil prices were and still are completely depressed.  Canadian dollar down due to commodities weakness.

All the bad news was summarized in this Globe and Mail review:

http://www.theglobeandmail.com/globe-investor/inside-the-market/market-updates/the-close-tsx-ends-tumultuous-year-by-dropping-1/article27975542/


In Feb 2016, the markets started to move up again.  Year to date returns for the overall TSX is at about 3% as at the end of March 2016.  So how did the portfolios hold up?  Let's see.


May2015 (M2015) portfolio


So it appears that the M2015 portfolio was quite stable throughout 2015, but it wasn't immune to the economic woes that hit the TSX.  Portfolio performance went into negative territory in both January and February of this year.  However, we see some resilience in our stock picks as the portfolio is now at it's highest point with just under a 9% return since inception.  So, for 10 months, we are seeing just under a 1% return per month.
Hopefully this performance will continue when the portfolio reaches it's one year anniversary.

The chart above compares the performance of the M2015 portfolio vs. the TSX in the same timeframe.  This is where you realize the portfolio is actually doing well with a difference of 20%.
Whereas the TSX is still under water since May 2015.


So here's a look at the individual stock performance within the M2015 portfolio.  Please note that  I took this snapshot on April 7th, so it doesn't show the holding values and performance as of March 2016.  Best four stocks are ATD.B (up16%), EMA (up15%) and WPK (up 23%) SJ (up 6%).  Worst stock is consistent laggard NA (down 12%).  Telus (down 1%) and DH (down 6%) are just meh.

Dividends returned are $389 which gives us a portfolio dividend yield of 2.35% (389 / 16565).


May2014 (M2014) Portfolio


Looking back at the chart for May 2014, it was quite a ride for 2015 wasn't it?  Remember when our one year performance was 25%?  Wow.  Now we are back down to earth.  The portfolio pretty much gave up all of it's gains in January 2016.  As of March 31 though it is now giving us a 12% return since inception.  In May of this year, we will determine what our yearly average return has been over the past 2 years. I'm guessing now we will see about one half of one percent per month return.

The portfolio vs TSX comparison graph shows us that we doing about 20% better than the returns from the TSX.  Basically if you had just put your money two years ago in a mutual fund or index that tracks the market, you'd be losing money right now, plain and simple.


Winners:  GIB.A (up 72%), GIL (up 38%), GC (up 19%).
Losers:  EQB again (down 17%), WFT (down 7%), LNR (down 5%), STN (flat).
Dividends accrued are $501 giving us a portfolio dividend yield of 1.28%.

Ok, so that's it for now.  Next post update will be in May 2016.