Monday, December 4, 2017

Model Portfolio Review at Dec 01, 2017

 Preface

Google Finance announced the retirement of it's portfolio tracker in the summer of 2017.  This blog gathers it's data and graphs exclusively from Google Finance and with the deprecation of the portfolio management, updates to this blog will also come to an end.  

I still haven't found another free portfolio tracker on the web, but I will continue to look and maybe one day I can continue my portfolio updates.

I have managed to capture the portfolio data this one last time before it all vanishes, so here is the final post for this blog.   


Portfolios

May 2014


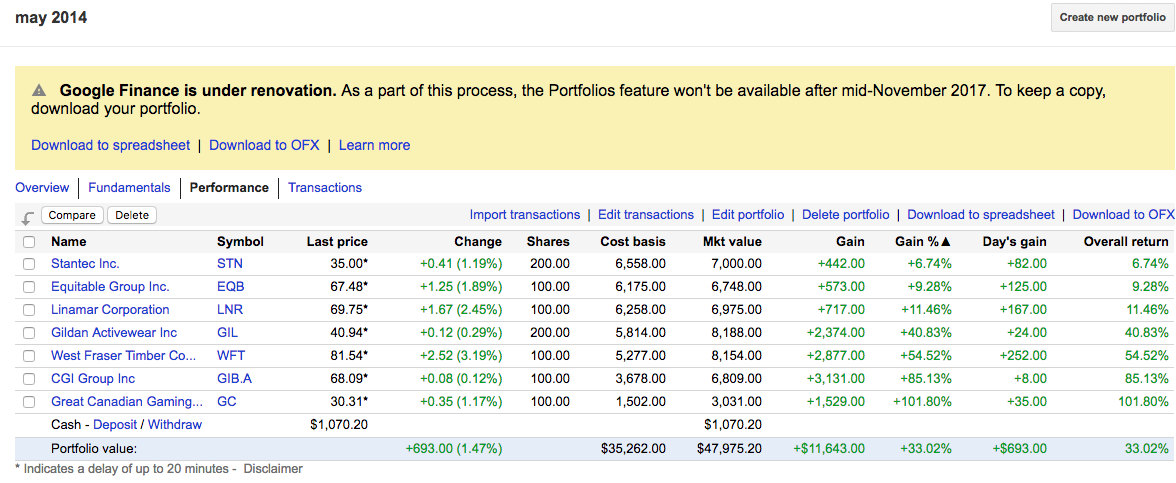
All stocks are showing positive returns, majority with double digit gains.  Best Stocks:  GC 101% and GIB.A 85%.   

YTD returns of the portfolio are 33%.  On the initial investment of $35,262, the portfolio is now worth $47,975, an increase of $11,643.  Dividends accrued is $1070.

Annualized ROI is approx 9% year over year for the past 3.5 years, inclusive of dividends.


Performance graph May 2014 thru November 2017 and shows a total YTD return of 36.3%, giving us a dividend yield of 3.6%.  M2014 portfolio is now at an all time high.


M2014 portfolio returns of 36.3% as compared to TSX 10.7% over the same period.  Pretty much outperformed the Toronto Stock Exchange over the entire period.


M2014 transaction data captured for future reference.

May 2015


The M2015 portfolio is also showing positive returns on all it's stocks.  Every stock return is in the double digits.  Best stocks of this portfolio are ATD.B 35% and NA 31%. 

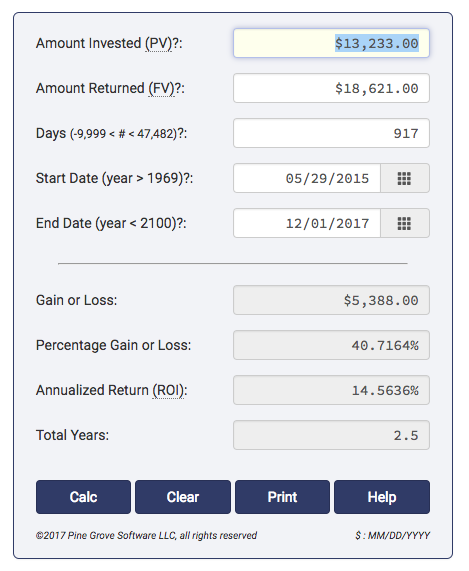
Total investment of $13,233 now has a value of $18,621 for a gain of $3009.  Portfolio return is 23.19% excluding DH and 15% adjusted for DH losses.  DH residual value and dividends totalled $2319.


M2015 annualized return is 14.5% over 2.5 years.


The performance graph for the M2015 portfolio shows a total 21.9% return inclusive of dividends (includes DH loss).  This portfolio is also at an all time high.


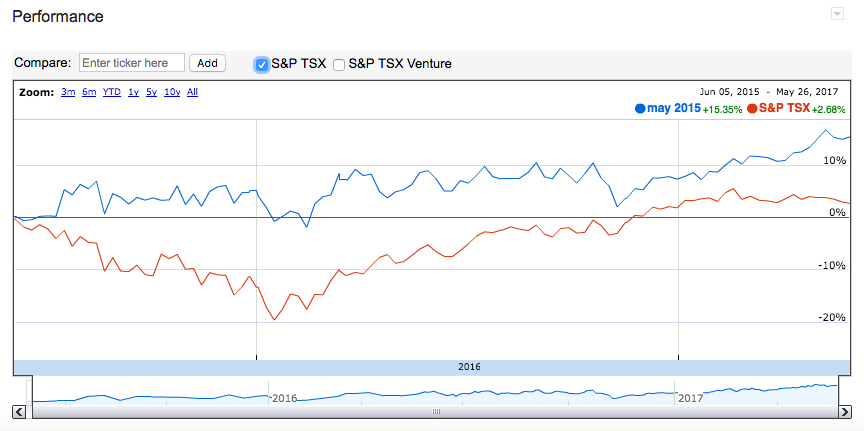
During the past 2.5 years, the M2015 portfolio 21.9% outperformed the 7% returns of the TSX.


M2015 transaction data above.

May 2016


With the exception of CRT.UN, all stocks are in positive territory.  Best performing stocks in this portfolio are ECI 24% and AQN also 24%.  

Total investment of $35,045 is now worth $41,217 that includes dividends of $2578 and gains of $3593.  Portfolio gain is 10.25%.


Total portfolio gains amount to $6172 for a year over year annualized return of 11.15% over the past 1.5 years.


The M2016 portfolio peaked in June 2017, but is now back near it's high.  The total return is 17.85% inclusive of dividends.


The TSX was much stronger over the past 1.5 years with a solid 15.42% return.  The M2016 portfolio managed to just better it at 17.8% as you can see from the graph.


 Here are the M2016 transactions.

 May 2017


The M2017 portfolio is definitely not performing as desired, losing about 2.5% year to date.  Initial cost of this portfolio was $17,327 but it is only worth $16,983 giving a loss of $429.

Best performers of this portfolio are TSGI at 21.4% and RCH at 11%.  The big drags on this portfolio are UNS down 29.47% and CAS down 22%.

We are about two thirds into this portfolio's lifespan and it is showing -3.3% ROI.


With the small amount of dividends this portfolio has generated, it reduces it's overall loss to -1.6%.  It has never shown a profit to date.


The M2017 couldn't even beat the lacklustre performance of the TSX's 3.37% and the performance deficit appears to be widening.


The transaction data for M2017.

Sunday, October 15, 2017

Model Portfolio Review at Sep 02, 2017


M2014 Portfolio


Holdings and Performance


EQB is the only stock showing a loss, all others posting gains.  GC continues to be the winner in this group with a whopping 127% return.  Portfolio has increased in value $8075, posting a 22.9% gain.


Since inception, the graph shows a total portfolio return of 25.89% which includes dividends.  This implies a dividend yield of about 3%. Over the same period of time, the TSX eked out a mere 4.66%.


Plugging the portfolio data into our ROI calculator, we get 7.1% annualized (year over year) return.

M2015 Portfolio


Holdings and Performance

Doing much better on this portfolio, everything is showing positive returns.  SJ and T are giving us single digit returns, whereas the top performer WPK is up 32%.  As I mentioned in my previous post, DH was bought out and is no longer traded on the TSX.  We therefore experienced a loss of 37.5% on this stock before it stopped trading.  With the loss of DH, the overall portfolio return is now 9.5%.  The portfolio performance gain  without DH is $2225 and up 16.8% , before dividends are factored in.


Despite the loss of DH, the M2015 portfolio is still far exceeding the TSX's overall return of 1.1%.


Factoring in dividends, the yearly return without DH is 13.6%.  


M2016 Portfolio


Holdings and Performance

Starting to see a performance pullback in the M2016 portfolio.  CRT.UN, FCR and ITP are laggards and in the red.  Best performing stock of this group is ECI.  Overall, the portfolio is up a modest 7.5%.


Interesting to note that the TSX rebounded in the past year posting a healthy return of 9%.  With dividends, the M2016 portfolio managed to better the TSX return at 13.9%.  The dividends generated are almost doubling the performance of this portfolio (7.5% vs 13.9%).  Dividend yield is therefore 6.4%.

On an annualized basis, the M2016 portfolio is returning a respectable 10.4%.

M2017 Portfolio


Holdings and Performance

I think I accidentally deleted the screen shot for the M2017 holdings, so here is a more current one from October 15.  The performance graph is accurate though.  This portfolio has done poorly from the outset.  From May through September is has continued on a downward trend.  Almost all stocks are in a negative position with the exception of RCH.  Worst performer is UNS down over 20%. In September this portfolio was down a staggering 8% for the past 6 months.   I won't calculate the annual ROI until the portfolio has passed the one year mark.


Summary


Portfolios and total overall returns (inclusive of dividend yield), at Sept 2017

May 2014 - 25.89% (up, previously 16.42% in May 2017)
May 2015 - 13.6% (down, previously 15.36% in May 2017)
May 2016 - 13.9% (down, previously 16.17% in May 2017)
May 2017 - (8%), down since portfolio inception

Tuesday, June 27, 2017

Musings: Real Estate Vs. Stocks, Yet Another Thought Exercise

I was sipping my hot chocolate this morning as I was thinking about my portfolio returns, total vs. annualized and benchmarks.  As you know, I always like to compare the performance of my portfolios to the Toronto Stock Exchange (TSX) as another data point.

With the recent gains and hoopla surrounding Toronto real estate, I started to wonder, would it have been better to hold stocks or real estate in the past 5 years.  I say 5 years because it sort of corresponds to the amount of time I have been tracking the model stock portfolio performance.  I did a google search on Toronto house prices over the past 5 years and came across this article from the Toronto Star dated Tuesday April 18, 2017.

http://www.ctvnews.ca/canada/in-charts-tracking-house-prices-in-canada-s-hottest-housing-markets-1.3373632

Now, just in case they retire the story, the article reviews home prices across Canada and they provide some statistical data.  The first graph reviews home values in major Canadian cities in the first quarter of 2017.


A second graph looks specifically at Vancouver house prices vs. Toronto house prices.

The third graph describes the current average home price of a Toronto detached home.

 And finally, what I was really looking for, the 5 year monthly average price of a home in Toronto.

According to the article, they track the increase of the average Toronto home price from March 2012 to March 2017, and they show that home prices increased 62.5% over the past 5 years.  I wanted to see what that looked like as a year over year increase so I arbitrarily picked the dates of March 1, 2012 and March 1, 2017 to plug into the ROI calculator.  I used the starting price of $554,000 and a final price of $899,000 as per the data provided from the graph.


And here's the result.  It shows that the money increased at a yearly rate of just over 10% year over year.  That's pretty darned good.  Ok, but we need to consider some things pertinent to this investment.

Consider if we were buying the property purely to flip over the five years.  We would have made $345,000.  However, we have to factor in the cost of buying the house, such as legal fees and closing costs as part of the initial purchase.   Here's a list of typical closing costs:

http://www.themillsteam.ca/buying/costs-associated-with-buying-your-own-home/

So I'm going to plug some numbers in, based on the purchase price of $550,000.  I'll use the low end of the ranges provided for purposes of this discussion.

Appraisal/Home Inspection: $500
High Ratio Mortgage: N/A (I'll assume we don't need this).
Combined Ont/Toronto Land Transfer tax: $550,000 x .04 = 22,000, then less $7050 = $14,950
Legal fees/disbursements: $1200
Title Insurance: approx $600
Adjustments: $400
Home Insurance: $1000

Buying cost Subtotal:  approx $19,000

Then, we have ongoing costs of carrying and maintain the home over five years.  This would include mortgage payments, utilities:

https://www.thestar.com/life/homes/2012/04/16/the_true_cost_of_home_ownership_ouch.html
The preceding article is probably a bit dated, but you get the point.

Property taxes: let's say $4000 per year - totally arbitrary
Condo fees: We'll assume a detached home so $0.
Ongoing maintenance and utilities:  $100/month, so $1200 per year
Mortgage payment:  I'll use an arbitrary number of say $2000 per month, assuming we have a decent down payment.

Ongoing cost subtotal: $4000 x 5 = $20,000, $1200 x 5 = $6000, $2000 x 12 x 5 = $120,000 =
$146,000

Ok, so then after 5 years, we decide to sell it for $899,000.  Here's the costs associated with selling:

http://www.melissaemond.com/much-cost-sell-house-toronto/
According to the preceding article, the following costs are:

We will assume a principal residence, so no capital gains. $0
Legal fees: $1200
Real Estate commissions: 899,000 x 3% = $26,970

Selling cost subtotal: $28,170

Total costs over 5 years:  buying + ongoing + selling = $19000 + 146000 + 28170 = $193,170!!!
This assumes that the property is not rented because it's our principal residence.

So, if we subtract the total costs of $193,170 from our profit of $345,000, that leaves us with a new sum of $151,830.  That's our true return from this transaction.  So now we take $554000, the original cost of investment and add $151,830 = $705830.

We take that number and plug it back into our year over year calculator and this is what we get:


The true return after 5 years is now 27.4 % with an average annual return of 5%.   

Some other factors to consider:  During this time, our investment was not liquid, ie: you can't just sell it right away.  We considered this property as being a principal residence, but if it had been an income property, we might have rented it out for income over the past 5 years to offset the costs but it would have been subjected to capital gains tax upon sale.

So that was a look at holding some property for 5 years.  Now, lets revisit one of our model portfolios - the oldest being M2014.  It has a total return of 24% after 3 years.


So, let's plug in the current values of the model portfolio and see what our year over year return is.


We see a return of 7% year over year.  If we take the 7% and apply it to the amount used to invest in real estate, ie 554,000, for the exact same time period of Mar 2012 thru March 2017, it would be worth ....


Stock investment over 5 years:  $780,651, park it and forget it.


Real estate over 5 years:  $705,830, buying, carrying and selling.


So, which would you choose?


Saturday, June 17, 2017

News: Amazon Buys Whole Foods Market

So the big news this week is that Amazon (AMZN) has bought Whole Foods Markets (WFM).

http://www.cbc.ca/radio/asithappens/as-it-happens-friday-edition-1.4164029/amazon-s-whole-foods-deal-another-tech-company-swallowing-ever-greater-portions-of-our-economy-1.4164035

And this is the impact it had on our Feb 2017 portfolio F2017.  If you recall, this portfolio was made up entirely of food and grocery stocks.


The portfolio dropped by almost 2% and is now losing money.  Today's news reinforces the idea of diversifying your stock portfolio.  I'll continue to watch this portfolio to see if it rebounds over the next few months.

Monday, May 29, 2017

Review of Model Portfolios as at May 28, 2017

Hi and welcome back to my stock portfolio blog.  Wow, it's been three years since I started it and I can't believe how time flies.  

The TSX is slumping yet global stock markets are still strong.

I remain cautious right now.
Let's now examine the portfolios of the past three years.

May 2014 Portfolio


Most of the stocks in the M2014 portfolio are doing well.  LNR and STN are both down a bit but not much.  Strongest stocks in this portfolio are GIB.A and GC.  EQB is down close to 20%, mostly due to the recent events surrounding mortgage lender Home Capital Group (HCG).  There haven't been any reported problems at EQB, but it's being painted with the same brush as HCG.


Overall the portfolio is returning 13.7% before dividends and including dividends of 16.4% over the past 3 years, so our dividend yield is just under 3%.  On a year over year basis, the portfolio is doing about 5% each year, which is kind of meh.

For those of you with financial advisors that are managing your portfolios, make sure that you are asking them to provide you with both sets of numbers, ie Overall performance to Date and Year over Year performance.  You might have a great one year return, but you'll want to know how your portfolio is doing over it's lifespan to get a better idea of the overall portfolio health.

Oh another thing, don't forget to subtract the fees you pay your financial advisors from the portfolio calculations because they will have an impact on your overall return.  Ask your FA if your portfolio performance is net of their fees or not.

On the bright side, the M2014 portfolio is faring much better against the TSX for the past 3 years.  The TSX has only returned a total of 6.2%, or about 2% year over year.   Still better than current GIC returns but just barely.

May 2015 Portfolio


Here's our two year old portfolio.  Again, most of the stocks are doing well.  Stella Jones (SJ) is borderline and the worst performer is fintech company Davis and Hendersen (DH).  DH is being bought out and the transaction closes by 3rd quarter of this year.  There is no more hope of this stock rebounding and the next time we review this portfolio, it will probably be gone.  Strongest stocks in  this portfolio are WPK and ATD.B.

The M2015 portfolio had more of a dividend focus and that has made a strong impact on the returns.
Before dividends, the portfolio returned 9.7% but inclusive of dividends, this portfolio returned 15.3% over two years.  Dividend yield was a healthy 5%. Year over year performance is 7.4% each year.  If you look at the graph, we see a surprising correlation between it's jump in performance and Donald Trump's presidency, both occurring around the November timeframe.  Heh.  Wait until you see the M2016 performance chart.

As compared to the TSX, this portfolio performed much better than the TSX average of 2.6%.

May 2016 Portfolio


Our one year old portfolio is doing exceptionally well.  There is one stock which isn't faring so well, retail property owner/operator First Capital Realty (FCR), down about 5%.  Best performers are AQN and RNW both of which are renewable/electric power generation companies. Hey, wasn't I supposed to diversify?  Why do i have two companies in the same sector?  Oops, my bad.

Well, the portfolio performance is benefitting from my mistake.  It's up 11% over the past year. and when you factor in dividends, the portfolio return jumps to 16%.  Our dividend yield is therefore 5%.
The portfolio performance was actually starting to slump until Donald Trump won his presidency, and then the performance just took off.  Now the performance is starting to peter out, which just happens to be after his first 100 days in office.  Crazy, huh?

Surprisngly, the TSX has had a decent year also with an average return of over 10%.  But we still beat that performance, which is all that matters.

Feb 2017 Portfolio


Here's the non-diversified food and grocery portfolio from earlier this year.  Definitely the grocers like Metro and Loblaws are having a banner year so far, up 15% and 13% respectively in just under 4 months.  However the rest of the food industry stocks are all just treading water.

It's too soon to predict what the one year performance of this portfolio will be but right now we are doing  about 2% to 3% for the quarter year.

You can see that the overall food stocks (excluding L and MRU) are faring no better than the rest of the TSX which is also treading water.

May 2017 Portfolio


So that brings us to our newest M2017 portfolio.  I created this portfolio just days before the market sold off, which is why most of the stocks are underwater.  As I mentioned in my last post, it's getting harder and harder to find stocks which match my criteria for these portfolios.  To reiterate what I'm looking for:

Market Cap over 1B
P/E ratio under 30, preferably under 20
Positive EPS
Beta under 1
Share price above $10
Positive trajectory in 1 and 5 year performance
Decent dividend yield of above 2% is bonus

Yup it's been down close to 3% for the past month.

Even the TSX is doing better than the latest portfolio.  Well not really at -1%, but whatever.


Summary


Portfolios and total overall returns (inclusive of dividend yield)

May 2014 - 16.42% (down, since last checked in Feb, 2017)
May 2015 - 15.36% (up, since last checked in Feb 2017)
May 2016 - 16.17% (up, since last checked in Feb 2017)
Feb 2017 - 3.52% (for 3 months)
May 2017 - (2.91%), down since portfolio inception


 Anyways, we will look in again around the August or September timeframe.   See you then.