Wednesday, March 1, 2017

New 2017 Portfolio - March 1

As promised in my previous post, today I will give you the details about this new model portfolio I have setup for 2017.  Normally I create my portfolios around the May timeframe but with all the uncertainty around Donald Trump's presidency, I decided to create this new one around the time of his inauguration. So I created this portfolio during the first days of February 2017.

I have also strayed from my approach of portfolio sector diversification in this portfolio, so I would not recommend that you seriously consider using this Food and Grocery centric portfolio as something to invest in.  We are purely looking at this from an academic standpoint.

Ok so here is the Feb 2017 portfolio, F2017 for future reference.  It consists of seven stocks as always, because I think seven is a nice manageable number of stocks in a portfolio. The stocks in this portfolio are all grocery or food companies.

It has been a month since I created this portfolio and is now returning about 2.5%.


The stocks in this portfolio are:  AW.UN (A&W Revenue), MRU (Metro), PZA (Pizza Pizza Royalty), SAP (Saputo), BPF.UN (Boston Pizza Royalties), MTY (MTY Food Group) and L (Loblaws).

The above Google Finance chart shows the stocks data such as Market Cap, EPS, P/E ratio and Beta.  We have a mix of smaller companies and larger ones in this portfolio.  The smaller ones are income trusts, much like mutual funds, but can be bought and sold on the TSX.

For our model portfolio, I bought 100 shares of each company.   Below is more data about each stock with a corresponding 1 year return graph.  Again, you can find all of this information on Google Finance by searching for the stock name.


AW.UN has had an excellent year to date and a 42% return. It has a dividend yield of 4%.


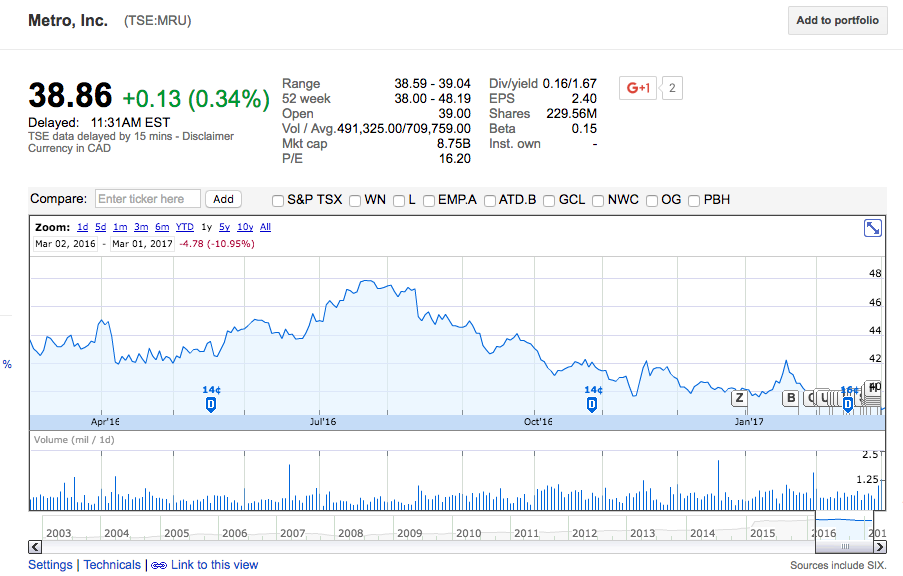
MRU is down 10% over 1 year and a dividend yield of 1.67%.  


PZA is up 39% in the past year and has a dividend yield of 4.83%.


SAP one year return is 16% with a dividend yield of 1.31%.


BPF.UN had a return of over 23% in the past year and it's dividend yield is a whopping 6%.


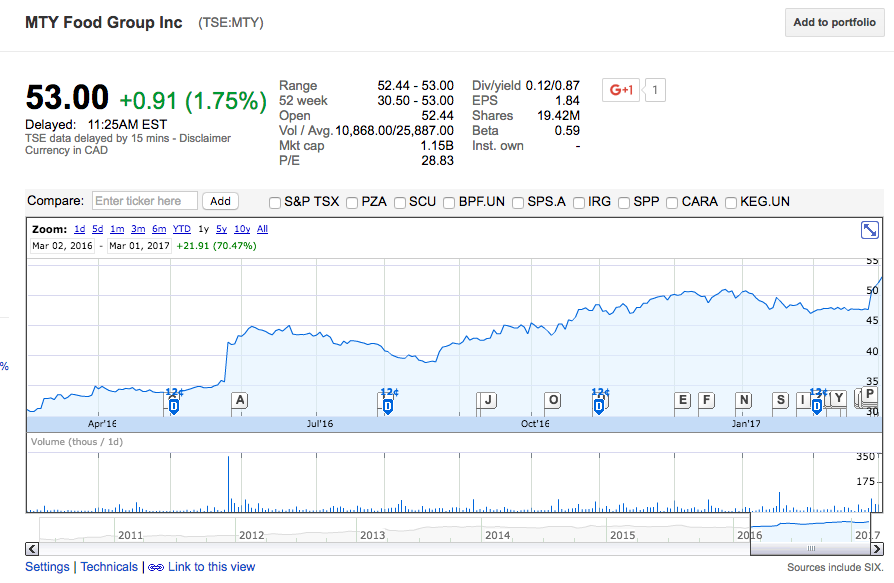
MTY had an amazing one year return of 70% with a small dividend yield of .87%.


L is at about the same price as it was last year, so no gains and the dividend yield is 1.5%.

Clearly, we have a mix of winners and losers in this group of stocks.

If we examine the first chart again, we see that MTY is stand out stock of the portfolio after one month.  L and AW.UN are tracking at the portfolio average and the remainder of the stocks are just average.


The F2017 model portfolio has already given some dividends and that is reflected in the graph above. The blue line is the performance of this portfolio and the red line is the performance of the TSX during the same one month.   It says our return is 3.22% so we have a 0.7% dividend yield at this point in time.  I always like to see that the portfolios I create outperform the TSX, so we are off to a good start.

Full disclosure: I don't have any of these stocks in my own portfolio right now.

We will revisit this and all the other portfolios performance in May 2017.   See you then.